


A Slide Rule for use with Engine Indicator Diagrams
Originally published in Slide Rule Gazette Issue 9, Autumn 2008
Originally published in Slide Rule Gazette Issue 9, Autumn 2008
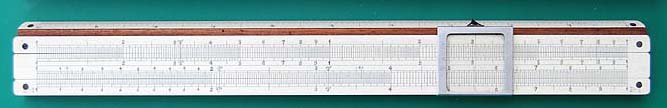
Fig.1. Thornton 6039½ slide rule
Figure 1 shows the slide rule, which is the subject of this article. It is a ten-inch, celluloid faced, mahogany rule with an aluminium-framed cursor. On the upper faces it has the usual A, B, C and D scales, whilst the reverse of the slide has S, L and T scales. It has a cm ruler on the lower edge. The novel feature is the special fiftieths inch scale on the upper edge and the associated pointer on the cursor. In the well it has an ordinary inches/eighths ruler and “DRGM 164885” which indicates that it was made by Albert Nestler, and refers to the screws holding the celluloid facings on.
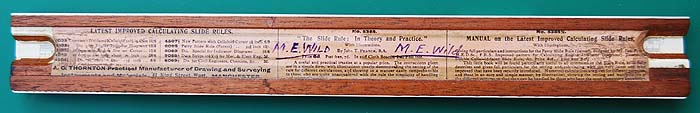
Fig.2. Thornton 6039½ slide rule, reverse
Figure 2 shows the reverse. At the bottom left hand is “A G Thornton, Practical Manufacturer of Drawing and Surveying Instruments and Materials, 41 King Street West, Manchester”. Above this are two columns listing Thornton slide rules, including this one. It also lists two Perry slide rules, the 6068 and the 6069, the latter being the Perry rule with the special scale and cursor for use with engine indicator diagrams. It should be noted that these are the catalogue numbers for the original versions of the Perry rule, which were superseded by “improved” ones after only a couple of years. Thornton’s book, published in 1906, (ref.1) has a pull out plate of the slide rules then available and this shows the improved Perry rules, catalogue numbers 6956 and 6957. Thornton moved to the King Street premises in 1904, suggesting a date of 1904 or 1905 for this slide rule.
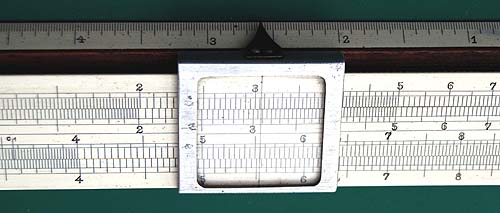
Fig.3. The pointer on the cursor and the 1/50th inch scale
Fig.3. is an enlarged picture of the cursor and the special fiftieths scale. I will say more about how this is used to evaluate engine indicator diagrams once I have explained what an indicator is and how it is used.
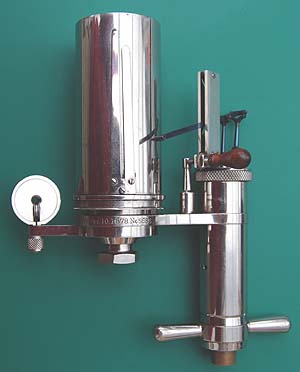
Fig.4. shows an engine indicator in my collection. It consists of two main components, namely the steam cylinder (bottom right) and the recording drum (top left). The steam cylinder is connected, via a cock, to the engine cylinder. Inside the steam cylinder there is a piston, the upward movement of which is resisted by a spring. The piston in turn is connected, via a straight-line mechanism, to the recording pencil. This can be placed against the chart using the wooden handle. The chart drum has spring clips to retain the chart and is rotated by a cord passed through the pulley arrangement on the left and connected to a reducing lever driven by the engine crosshead. There is a return spring located within the drum.
The spring inside the steam cylinder, which resists the motion of the piston, has to be selected for the engine working pressure and a wide range of springs were available from the engine manufacturers. My indicator has five alternative springs for different engine working pressures. These are marked with the pressure rating in psi/in (pounds per square inch pressure, per inch deflection). A table inside the lid of the instrument box says which range of working pressures each spring should be used for.
Fig.4. A Tabor engine indicator by The Ashcroft Manufacturing Co., Bridgeport, Connecticut, USA
Many years ago, as a first year mechanical engineering student at Leeds University, I had to use one of these to determine the indicated horsepower of a large Marshall horizontal compound steam engine. They could also be used on slow speed gas and oil engines and I used indicators on them as well. I sometimes wonder if they still have these engines?
Although the principle use of the diagram produced was for calculating the indicated horsepower of the engine, the shape of the diagram would also tell an experienced engineer quite a lot about how well the engine was working as well. However, we are just interested in horsepower determination. To determine that, we need to analyse the indicator diagram to find the mean effective pressure in the cylinder. The equation for the indicated horsepower (IHP) is:
IHP = Pm.L.A.N/33000
Where Pm is the mean effective pressure, L is the piston stroke, A is the piston area and N is the engine speed in revolutions per minute. If the cylinder is double acting then the powers for each end need to be added together, and the powers for each cylinder need to be added for multi-cylinder engines to find the total engine IHP.
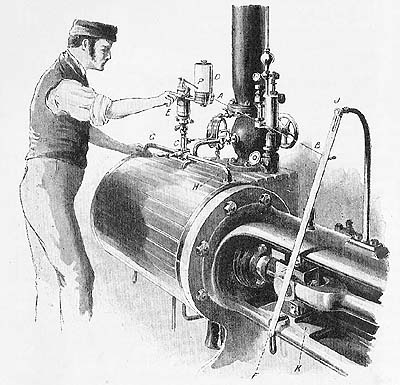
Figure 5, taken from ref.2, shows an indicator in use on a horizontal steam engine. The indicator is connected via a 3-way cock and pipework to both ends of the steam engine cylinder, which is double acting (i.e. steam is admitted to both sides of the piston alternately). With one hand he is opening the cock to admit steam from one end of the cylinder, whilst with the other he is placing the pencil on the chart. A cord to rotate the chart drum has been attached to the reducing lever at B, which is driven at its lower end by the engine crosshead. Incidentally, the author of ref.2 is the same John Perry who invented the log-log slide rule named after him and also produced by A G Thornton.
Fig.5. An indicator in use (from “The Steam Engine” by John Perry D.Sc., F.R.S.)
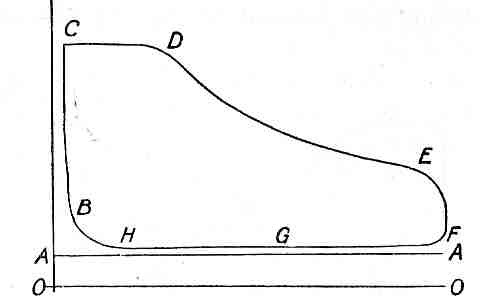
Fig.6. A typical indicator diagram (from “The Steam Engine” by John Perry D.Sc., F.R.S.)
Figure 6 shows a typical steam engine indicator diagram for a non-condensing engine. The vertical ordinate is cylinder pressure and the horizontal ordinate represents piston stroke. ‘AA’ is the atmospheric pressure line and is drawn while steam is not being admitted to the indicator. Steam is admitted at B, just before the stroke commences, and the pressure rapidly rises to C, where the stroke starts. Steam continues to be admitted to the point of ‘cut-off’ at D, from which point the steam expands in the cylinder, still doing work, until release at E, before the end of the stroke. F to H is the back stroke, exhausting the cylinder until at H cushioning begins prior to steam admission again at B.
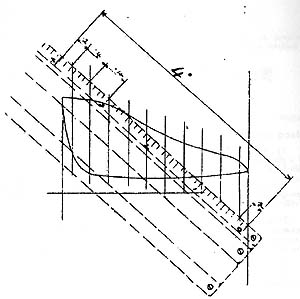
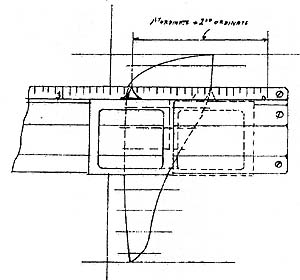
Fig.7. Using the slide rule for calculating the indicator diagram (from “Particulars and Instructions of Improved Calculating Slide Rules”, A G Thornton, UKSRC reprint)
The quickest and most accurate way to obtain the mean effective pressure is to use a planimeter (Fig.9.). These were expensive instruments, so a more ordinary way was to divide the diagram into ten equal divisions as in Fig.7. above. A scale (Fig.8.) corresponding to the strength of the indicator spring was then used separately to measure the mean heights of the divisions, which were then summed and the overall mean calculated. The number of steps in this process, Thornton maintained, would be prone to error and this slide rule was designed to mechanise the process and hence reduce the likelihood of errors.
With the improved cursor the heights of successive ordinates are added continuously, as shown in right hand part of Fig.7, by starting from zero on the first ordinate and sliding the pointer along the length of each ordinate in succession. Only the final reading needs to be noted. This figure multiplied by the spring strength, and divided by 10 gives the mean pressure. These instructions have been rephrased from those given in reference 3.
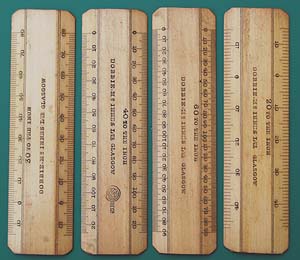
Fig.8. Scales for measuring heights on indicator diagrams
Fig.8. shows four scales by Dobbie McInnes, which came with my engine indicator, which correspond with four of the five springs supplied. The scale length is approximately four inches as that is the maximum height that can be plotted on the indicator chart.
Figure 9 shows an Amsler planimeter, supplied by Dobbie McInnes that is specially constructed for measuring engine indicator diagrams. It will be seen that there are two vertical protrusion from the tracing arms; actually it is the covers over two sharp points that can be seen in the picture. The right hand one is fixed to the arm. The other is actually fixed to the carriage. To use it for evaluating the mean effective pressure the carriage is moved along the tracing arm until the distance between the two points equals the length of the indicator diagram. This sets the scale so that, with the pole outside the diagram, the reading of the planimeter divided by 0.4 is actually the mean height in inches, which then only needs to be multiplied by the spring strength to obtain the mean pressure. (ref.1).
References
1. Mathematical Drawing Instruments and Materials, A G Thornton, Percival Marshall & Co, 1906
2. The Steam Engine and Gas and Oil Engines, John Perry D.Sc, FRS, Macmillan & Co, 1902
2. The Steam Engine and Gas and Oil Engines, John Perry D.Sc, FRS, Macmillan & Co, 1902
3. Particulars and Instructions of Improved Calculating Slide Rules, A G Thornton, UKSRC reprint.
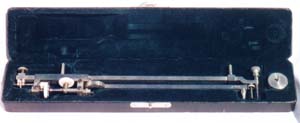
Fig.9. An Amsler No. 6 Planimeter for finding the Mean Effective Pressure from indicator diagrams
A chance find at a flea market turned out to be a rather special slide rule.